
Table of Contents
Introduction:
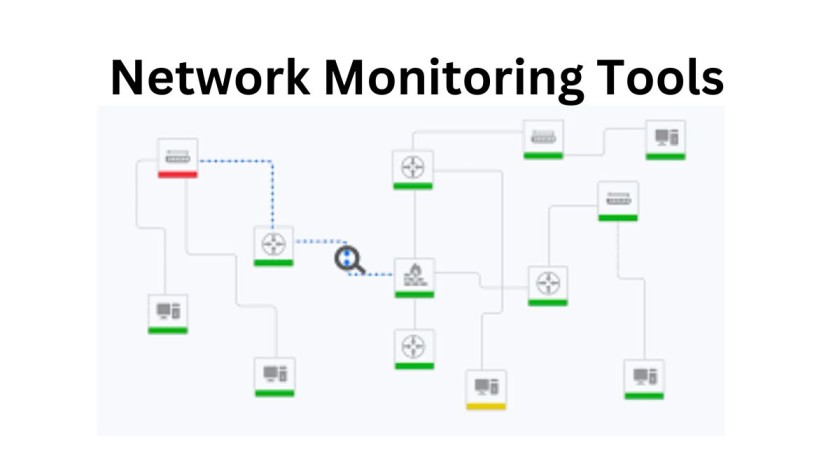
Network monitoring is a critical aspect of managing and maintaining the health and performance of IT infrastructures. It involves the continuous tracking, analysis, and reporting of various parameters within a network to ensure its optimal functioning. To achieve this, a variety of network monitoring tools have been developed, each equipped with features designed to address specific aspects of network performance.
These tools play a crucial role in helping IT professionals identify issues, prevent downtime, optimize resource utilization, and ensure a seamless experience for end-users. From monitoring bandwidth and traffic to analyzing packet-level details, network monitoring tools provide valuable insights into the overall health and efficiency of networks.
Top 20 list of network monitoring tools:
(1) Wireshark:

Introduction:
Wireshark is a powerful and widely used network protocol analyzer that allows users to capture and analyze the data traveling back and forth on a network in real-time. It is particularly valuable for in-depth packet-level analysis.
- Features: Packet-level analysis, protocol support, live capture, and offline analysis.
- Integrations: Limited third-party integrations.
- Pricing: Free and open-source.
- Trial: No trial as it is an open-source tool.
- Pros: Powerful packet analysis, and community support.
- Cons: Steeper learning curve for beginners, may be too detailed for some users.
(2) Nagios:

Introduction:
Nagios is an open-source monitoring system that enables comprehensive monitoring of hosts, services, and network devices. It offers flexibility through plugins, allowing users to customize monitoring according to their specific needs.
- Features: Host and service monitoring, alerting, reporting, extensibility.
- Integrations: Extensive third-party plugins.
- Pricing: Open-source (Nagios Core), Nagios XI has a commercial version with a free trial.
- Trial: 60-day free trial for Nagios XI.
- Pros: Highly customizable, strong community, robust alerting.
- Cons: Initial setup complexity and user interface can be overwhelming.
(3) PRTG Network Monitor:
Introduction:
PRTG is a user-friendly network monitoring tool that provides real-time insights into the performance of devices, applications, and network infrastructure. It offers a range of sensors for different monitoring requirements.
- Features: SNMP monitoring, customizable dashboards, comprehensive reporting.
- Integrations: Supports various third-party integrations.
- Pricing: Free for up to 100 sensors, various paid plans based on sensor count.
- Trial: 30-day free trial for unlimited sensors.
- Pros: User-friendly interface, auto-discovery of devices, mobile app.
- Cons: Limited custom scripting capabilities.
(4) SolarWinds NPM:

Introduction:
SolarWinds NPM is a robust commercial solution for network monitoring, offering real-time analysis, alerting, and reporting. It provides a unified view of the entire network and helps in identifying and resolving issues promptly.
- Features: Real-time network performance monitoring, alerting, and reporting.
- Integrations: Integrates with other SolarWinds products.
- Pricing: Commercial product based on the number of elements monitored.
- Trial: 30-day free trial available.
- Pros: Comprehensive network insights, and user-friendly interface.
- Cons: Can be expensive for larger networks.
(5) Zabbix:

Introduction:
Zabbix is an open-source monitoring solution known for its scalability and flexibility. It supports the monitoring of various parameters and is suitable for large and complex network environments.
- Features: Monitoring various network parameters, auto-discovery, and alerting.
- Integrations: Supports integrations through plugins and APIs.
- Pricing: Open-source (free).
- Trial: No trial for the open-source version.
- Pros: Highly customizable, active community, supports SNMP and IPMI.
- Cons: Steeper learning curve, may require more manual configuration.
(6) Cacti:

Introduction:
Cacti is an open-source tool specializing in network graphing and visualization. It allows users to create custom graphs for monitoring various network parameters over time, providing historical insights into performance trends.
- Features: Network graphing, data visualization, SNMP support.
- Integrations: Plugin architecture for additional features.
- Pricing: Open-source (free).
- Trial: No trial for the open-source version.
- Pros: Comprehensive graphing and visualization, community support.
- Cons: Configuration can be complex, and less intuitive for beginners.
(7) Splunk:

Introduction:
Splunk is renowned for its log management and analysis capabilities. Beyond logs, Splunk can be configured for network monitoring through plugins, providing a centralized platform for analyzing and visualizing data from diverse sources.
- Features: Log management, real-time data analysis, customizable dashboards.
- Integrations: Extensive third-party integrations, Splunkbase marketplace.
- Pricing: Commercial product with various pricing plans based on data volume.
- Trial: Free trial available with limitations on data volume.
- Pros: Powerful log analysis, versatile for different data sources.
- Cons: Cost may be a barrier for some organizations.
(8) Observium:

Introduction:
Observium is an auto-discovering network monitoring platform designed for simplicity. It provides SNMP-based monitoring, trend analysis, and automatic detection of devices on the network.
- Features: Autodiscovery, SNMP monitoring, trend analysis.
- Integrations: Limited third-party integrations.
- Pricing: Open-source (Community Edition), Observium Professional has a commercial version.
- Trial: No trial for the Community Edition, 14-day free trial for Professional.
- Pros: Simplified setup, focus on ease of use.
- Cons: Limited third-party integrations, less feature-rich compared to some competitors.
(9) ManageEngine OpManager:

Introduction:
OpManager is a comprehensive network monitoring software that covers network and server performance. It offers fault management, performance analysis, and customizable dashboards for real-time insights.
- Features: Network and server monitoring, fault management, and performance analysis.
- Integrations: Integrates with other ManageEngine products.
- Pricing: Commercial product with various editions and pricing plans.
- Trial: 30-day free trial available.
- Pros: Unified solution for network and server monitoring, user-friendly interface.
- Cons: Advanced features may require additional modules, and cost may vary based on requirements.
(10) LogicMonitor:

Introduction:
LogicMonitor is a cloud-based network monitoring solution that automates the discovery of devices and provides real-time insights into network and infrastructure performance. It’s known for its scalability and ease of use.
- Features: Automated discovery, cloud and on-premises infrastructure monitoring, and alerting.
- Integrations: Broad support for third-party integrations.
- Pricing: Commercial product with a subscription-based pricing model.
- Trial: 14-day free trial available.
- Pros: SaaS-based, automated setup, scalable for large environments.
- Cons: Higher pricing for larger networks, may have a steeper learning curve.
(11) Riverbed SteelCentral:

Introduction:
Riverbed SteelCentral offers end-to-end network performance monitoring, including deep packet analysis and application visibility. It’s suitable for enterprises seeking comprehensive insights into their network infrastructure.
- Features: End-to-end network performance monitoring, application visibility, packet capture.
- Integrations: Integrates with Riverbed’s other performance management solutions.
- Pricing: Commercial product with pricing based on the number of monitored devices.
- Trial: Available, contact the sales team for details.
- Pros: Comprehensive performance insights, and deep packet analysis.
- Cons: Higher cost, may be more suitable for larger enterprises.
(12) Statseeker:

Introduction:
Statseeker focuses on real-time network monitoring, providing insights into network performance and historical data analysis. It’s designed to scale for large networks with a considerable number of devices.
- Features: Real-time network monitoring, reporting, and historical data analysis.
- Integrations: SNMP and syslog support.
- Pricing: Commercial product with pricing based on the number of monitored devices.
- Trial: 45-day free trial available.
- Pros: Scalable for large networks, real-time monitoring.
- Cons: The interface may not be as modern as some competitors.
(13) NetCrunch:

Introduction:
NetCrunch is an automated network monitoring tool that includes features like network mapping, alerting, and reporting. It aims to provide a unified solution for monitoring a wide range of network elements.
- Features: Automated network mapping, monitoring, alerting, and reporting.
- Integrations: Supports SNMP, WMI, and various protocols.
- Pricing: Commercial product with a perpetual license model.
- Trial: 30-day free trial available.
- Pros: Intuitive user interface, automatic network discovery.
- Cons: May have a learning curve for advanced features.
(14) Spiceworks Network Monitor:

Introduction:
Spiceworks Network Monitor is a free tool offering real-time monitoring, alerting, and reporting for network devices. It’s particularly suitable for small to medium-sized businesses with straightforward monitoring needs.
- Features: Real-time monitoring, alerting, and reporting for network devices.
- Integrations: Integration with the broader Spiceworks IT community.
- Pricing: Free.
- Trial: N/A (Free to use).
- Pros: Free and easy to set up, community support.
- Cons: Limited scalability for larger networks.
(15) AppNeta:

Introduction:
AppNeta specializes in application and network performance monitoring. It offers insights into the end-user experience, making it valuable for organizations focusing on application delivery and user satisfaction.
- Features: Application and network performance monitoring, real-time insights.
- Integrations: Supports various integrations and APIs.
- Pricing: Commercial product with a subscription-based model.
- Trial: Contact sales for a demo or trial.
- Pros: Cloud-based, real-time monitoring of applications.
- Cons: Cost may be a consideration for smaller budgets.
(16) Dynatrace:
Introduction:
Dynatrace is an AI-driven monitoring solution offering full-stack visibility. It covers not only network performance but also application monitoring and AIOps, making it a comprehensive solution for modern IT environments.
- Features: Full-stack monitoring, AIOps, real user monitoring, cloud integration.
- Integrations: Extensive integrations with cloud providers and technologies.
- Pricing: Commercial product with pricing based on monitored hosts or cloud consumption.
- Trial: 15-day free trial available.
- Pros: AI-driven insights, automatic discovery of dependencies.
- Cons: Pricing may be higher for large-scale deployments.
(17) NetFlow Analyzer:
Introduction:
NetFlow Analyzer focuses on NetFlow and sFlow analysis, providing traffic monitoring and bandwidth analysis. It’s beneficial for organizations looking to understand and optimize network traffic patterns.
- Features: NetFlow and sFlow analysis, traffic monitoring, bandwidth analysis.
- Integrations: Integrates with various network devices and technologies.
- Pricing: Commercial product with pricing based on the number of interfaces.
- Trial: 30-day free trial available.
- Pros: Granular traffic analysis, customizable dashboards.
- Cons: The user interface may be less modern compared to some competitors.
(18) Icinga:

Introduction:
Icinga is an open-source monitoring tool that offers flexibility and modularity. It supports active and passive checks, allowing users to monitor various aspects of their network through customizable plugins.
- Features: Open-source monitoring, extensible and scalable, supports plugins.
- Integrations: Active community providing additional plugins.
- Pricing: Open-source (free).
- Trial: No trial as it is an open-source tool.
- Pros: Flexible and modular, supports custom plugins.
- Cons: Configuration may be complex for beginners.
(19) Cisco Prime Infrastructure:
Introduction:
Cisco Prime Infrastructure is a network management tool tailored for Cisco environments. It provides comprehensive device lifecycle management, making it suitable for organizations heavily relying on Cisco networking equipment.
- Features: Network management, device lifecycle management, wireless infrastructure.
- Integrations: Designed for Cisco networks, integrates with Cisco solutions.
- Pricing: Commercial product, contact Cisco for pricing details.
- Trial: N/A (contact Cisco for demonstrations).
- Pros: Tailored for Cisco environments, comprehensive device management.
- Cons: Specialized for Cisco devices, may be less suitable for mixed environments.
(20) NetSpot:

Introduction:
NetSpot is a Wi-Fi analysis tool specializing in wireless network planning and site surveys. It’s particularly useful for organizations focused on optimizing their Wi-Fi infrastructure.
- Features: Wi-Fi analysis, wireless network planning, site surveys.
- Integrations: Focuses on Wi-Fi network planning and analysis.
- Pricing: Freemium model with a paid Pro version for advanced features.
- Trial: Free version available, Pro version for advanced features.
- Pros: User-friendly Wi-Fi analysis, suitable for smaller environments.
- Cons: Primarily focused on Wi-Fi, limited general network monitoring.
Read more- Top 15 Air Cooler Brands in India
1 thought on “List of Top 20 Network Monitoring Tools”